Documentation for ChemMapper Server
1. Introduction
-
ChemMapper Server is a web-based open resource of chemical database searching via molecular 3D similarity calculation strategies with the help of SHAFTS, an in-house method combining the strength of molecular shape superposition and chemical feature matching. ChemMapper provides suggestions or hints for the drug discovery studies like:
-
Identifying the potential drug targets or exploring polypharmacology effects for the given bioactive compounds.
-
Exploring potential mechanisms for drug's side effects.
-
Discovering similar compounds to the given compound from the bioactive or screening database.
-
Performing scaffold hopping for the given bioactive compounds.
-
Performing superposition of your own interested compounds on the given query.
-
-
ChemMapper technically provides two types of chemical database searching services.
a. Target Navigator
Annotated active compounds profiling and corresponding binding proteins prediction for the given small chemical probes (drugs, natural products, and other bioactive or toxic compounds). ChemMapper is expected to deliver helpful information and visualized results for potential drug targets identification, polypharmacology analysis like profiling drug targets network and adverse effects prediction, and old drug repurposing. Target Navigator curates nearly 300 000 drug-like molecules from ChEMBL, DrugBank, BindingDB with appropriate pharmacology annotations of the protein targets, including protein names, species, UniProt links for detail information, biological functions, reactions, pharmacological actions, and bioactivities collected from HTS and journal published papers. Target Navigator also collects the single bioactive conformations from the PDB database, and the structural information for the enzyme chemical substrates from the KEGG database.
b. Hit Explorer
Hit Explorer provides virtual screening services to perform similar chemicals searching, active compounds scaffold hopping, and 3D structures superposition against several commercial, open accessed, or even user-uploaded databases, like Specs, MayBridge, ZINC Leadlike Set, and NCI Open Database Compounds.
All the chemical structures except the ones from PDB stored in ChemMapper contain multiple conformations for 3D similarity calculation. Omega (www.eyesopen.com, Openeye LLC) was used to generate maximum 50 low-energy conformations for each compound in ChemMapper. For the user uploaded target compounds, multiple conformations (at most 100) can be generated on-line with in-house method “Cyndi” prior to 3D similarity calculation if the “Generate Conformers” is toggled on. More conformers may increase the coverage of the conformational space and consequently increase accuracy in some cases, but reducing calculation time and server load and increasing calculation accuracy must be balanced out. -
To start with ChemMapper Server, you must provide a single query molecule structure (by sketching with JME applet, pasting a smiles string, or uploading a file in SMILES, SDF, or MOL2 format). Given the searching service selected (Target Navigator or Hit Explorer), ChemMapper will automatically generate a valid 3D conformation for the query in the case of lacking 3D coordinate’s information, calculate the 3D similarities between the query and each molecule in the target database, and then output the top ranked hit molecules’ structures, predicted 3D conformers as well as corresponding proteins annotations and bioactivity information (if any) in the result pages.
All the chemical structures and corresponding annotation information are collected from public databases. We cannot rule out that some of the data is erroneous, change over time or is too unspecific. In addition, the results of ChemMapper need careful interpretation and experimental validations will always be needed.
2. Three steps to submit a ChemMapper Server job
2.1 Prepare the query molecule.
-
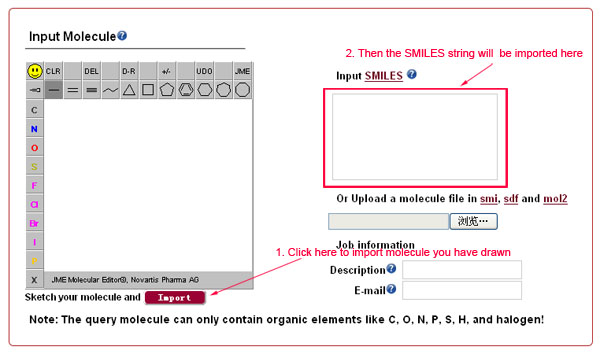
Sketch the desired 2D molecular structure in the JME applet window and click the "Import" button to translate to SMILES strings.
-
Input or paste a single SMILES string of the desired molecule into the “Input SMILES” text box.
-
Provide the molecular structure by uploading a file in smi, sdf, or mol2 format.
-
ChemMapper currently does not provide pharmacological space profiling service for multiple queries simultaneously; therefore please upload files containing single molecular structure information or input single SMILES string. Only the first molecule will be used as the query if multiple molecules are provided. The largest fragment will be remained if multiple fragments exist.
-
The 2D and 3D similarity metrics implemented in ChemMapper are appropriate only for small molecules like drugs, natural products, and other bioactive or toxic compounds with similar sizes. Please DO NOT upload other bioactive macromolecules as the query like proteins, nucleic acids, poly-peptides, nanotubes (including bulky balls), or other bio-inorganic compounds containing atoms other than C, H, O, N, P, S, and halogens. Any job involving such types of molecules will be terminated automatically.
-
For detailed information for the three file formats, please refer to corresponding documents as below:
-
MDL SDF: An acceptable SDF file (.sdf or .mol) consists of a header block and a connection table.
The format document is described on symyx web site.
-
SYBYL MOL2: A Mol2 file (.mol2) is a complete, portable representation of a SYBYL molecule.
The format document is described on Tripos web site
- Daylight SMI: A specification for unambiguously describing the structure of chemical molecules using short ASCII strings. The format document is described on Daylight web site.
-
MDL SDF: An acceptable SDF file (.sdf or .mol) consists of a header block and a connection table.
The format document is described on symyx web site.
- The users are recommended (not compulsory) to provide a short description for the job they submitted and a valid email address to which the links of the result pages will be sent as early as the jobs finish.
2.2 Options.
- The SHAFTS method adopts hybrid similarity metric of molecular shape and colored (labeled) chemistry groups by pharmacophore features for 3D similarity calculation and ranking, which is designed to integrated the strength of both pharmacophore matching and volumetric overlay approaches. The 3D superposition poses between the query and hit compounds can be visualized in the result page. More details about SHAFTS are available from the Download page.
-
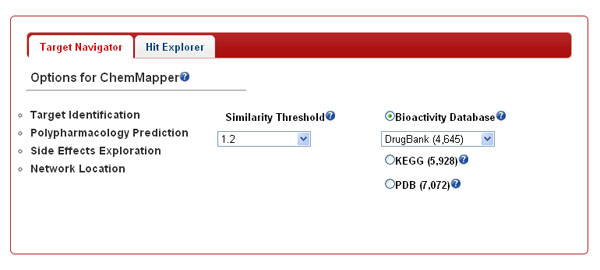
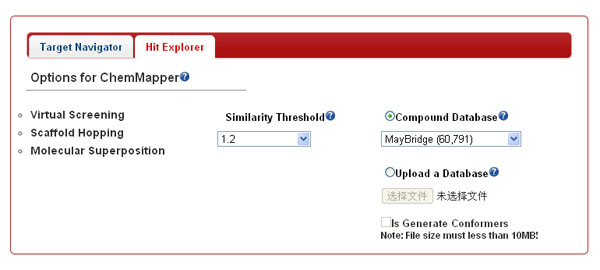
Similarity threshold The similarity score between the query and hit compounds are calculated and scaled to [0, 2]. The closer to 2.0 is the score, the higher potential of pharmacological association is there between the molecules. To limit the output size, only five thresholds (0.8, 1.0, 1.2, 1.5, and 1.8, with 1.2 as the default value) can be set and all the compounds below the thresholds are not shown. To limit the output size, maximum of 1 000 hit compounds are output for each job.
-
Service and Database Target Navigator and Hit Explorer services can be selected via the corresponding tabs.
-
Target Navigator. In this mode, ChemMapper curates the chemical structures (in both 2D and 3D formats) and corresponding bioactivity annotations from diverse source databases. Due to the larger sizes of them, the users are allowed to select single database one time for data accessing by toggle on the corresponding radio button.
-
Hit Explorer. In this mode, ChemMapper collected the chemical structures (in both 2D and 3D formats) from diverse commercial and public chemical vendors. Due to the larger sizes of them, the users are allowed to select single database one time for data accessing in the pull-down menu or upload an in-house mini-database (in SDF or MOL2 format) as the target for virtual screening or superposition on the query via SHAFTS, but the maximum size the uploaded file is limited to 10 MB, which is large enough to hold 2 000 to 3 000 molecules in MOL2 format. Multiple conformations (at most 100) can be generated on-line with in-house method “Cyndi” prior to 3D similarity calculation if the “Generate Conformers” is toggled on.
-
Target Navigator. In this mode, ChemMapper curates the chemical structures (in both 2D and 3D formats) and corresponding bioactivity annotations from diverse source databases. Due to the larger sizes of them, the users are allowed to select single database one time for data accessing by toggle on the corresponding radio button.
-
The computational speed for SHAFTS depends on the size of the target database selected and the complexity of the structure of the query molecule. The sever load and your position in the queue may affect the final waiting time. Generally speaking, SHAFTS is much slower than the conventional fingerprint-based 2D similarity methods because it has to perceive the molecular shape and chemical properties before similarity calculation. But it is much more accurate to some extent by incorporating shape and chemotype similarities simultaneously, and moreover, the alignment poses of the hit compounds can be visualized. As validated in the retrospective virtual screening against DUD set (dud.docking.org), the 3D similarity values over 1.0 usually imply high potential of enriching active compounds (DOI: 10.1021/ci200060s).
- Typically, searching medium-sized databases like ChEMBL and BindingDB with over 30M molecules (with at least 30 times more conformers!) can cost 12h-24h. For the small-sized one like DrugBank, PDB, and KEGG, the job can be finished within an hour. But for large-sized database like ZINC, a week is the bottom line you have to wait… So please think it over before you submitting a job with ZINC and never submit too many computation extensive jobs to occupy the job queue for months…
2.3 Submit job.
-
Just click on the “Submit” button and ChemMapper will redirect you to a submission summary page on which the status (“waiting”, “queue”, “running”, or “error”) of the job as well as the unique job id assigned will be displayed. The summary page is self-refreshed per minute and will redirect to the result page as soon as the job finishes.
-
The users can check the job running status via the link returned when the job is successfully submitted. Otherwise, the users can bookmark the URL shown in the summary page so as to access the result latterly. The same URL is also sent to the email address, if any, provided by the users. Moreover, the users can also input the unique job id displayed on the summary page in the “Get Result” menu to check the status of the job and access the final results as they are finished.

-
Due to the limit of server load, the submitted jobs are pushed into the queue sequentially before running. The users are notified with the queue status in the job status page after the jobs are submitted.
- The results for successful jobs will be remained on the server for at most 6 month.
3. Output and download
-
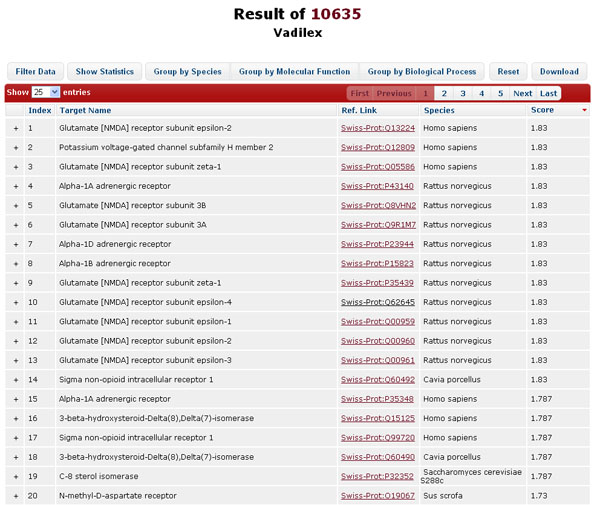
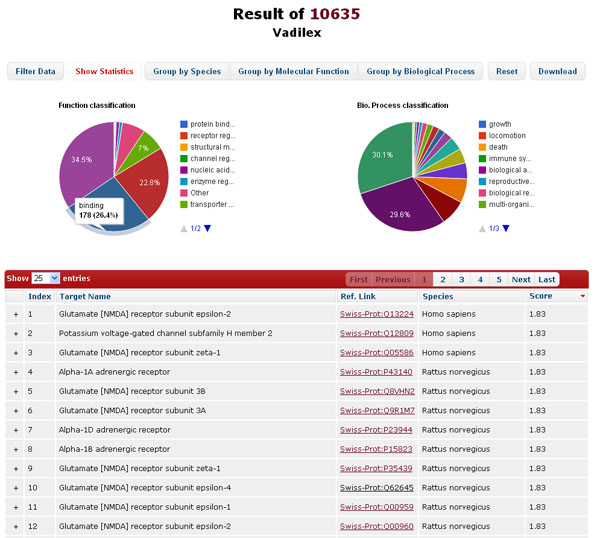
In Target Navigator mode, the results are shown in a table where each potential protein target is described in each row, ranked by the highest 3D similarity score of the corresponding bioactive compounds in descending order. The functional and pharmacological annotation of each protein target is also provided. The target annotations like target names, ref. links (UniProt), species, and the highest similarity scores of the corresponding bioactive compounds are displayed in corresponding columns. The 2D structure for the query compound can be displayed when cursor hovering over the corresponding job IDs.
-
The data in the result table can be reordered, filtered, or grouped by clicking the buttons above. “Filter Data” allows dynamic update of the result table by filtering the target name, species, and similarity score; “Show Statistics” summarizes the distribution of protein targets according to Gene Ontology (GO) in the form of pie chart; “Group by Species”, “Group by Molecular Function”, and “Group by Biological Process” reorganize the layout the table to group the result data into different groups, which facilitate the user to identify the potential protein targets according to available biological annotations. “Reset”, literally, remove the filters and reset the layout of the result table.
-
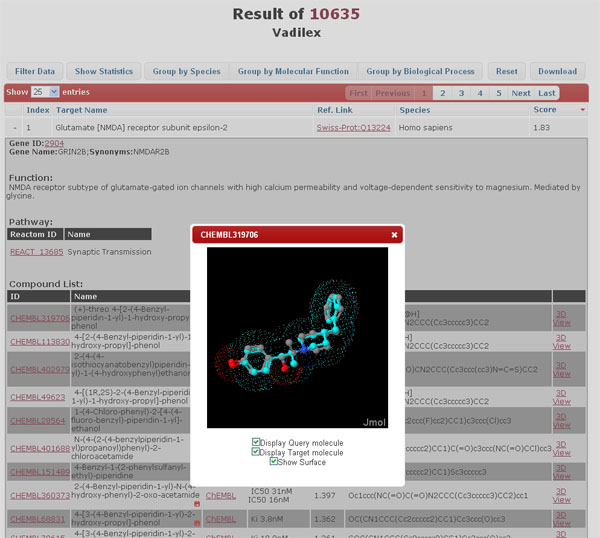
By clicking the "+" icon at the beginning of each row, more details about the protein annotation including gene name, biological function, biological pathway involved, gene ontology, pharmacological effects are presented in the drop-down sub-windows. The structural information of the corresponding bioactive molecules and annotations like external ID, name, source database, bioactivity or mode of action, and corresponding 3D similarity score against the query are also provided. 2D structures for the hit compounds can be displayed when cursor hovering over the corresponding molecular IDs. The visualization of the query-hit superposition can be displayed and manipulated in the JMol applet by clicking “3D View”. The extra information stored in the source external databases can be accessed via the hyperlinks of “Source DB”.
-
The 3D structural information as well as corresponding annotation in the result page can be downloaded in a zipped file containing a sdf molecule file as well as a csv summary file.

-
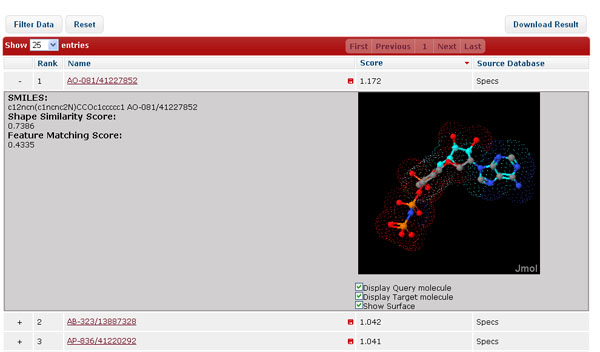
In Hit Explorer mode, the results are also shown in the table, where instead each candidate compounds is displayed in each row, ranked by the 3D similarity score. The predicted 3D alignment poses between the query compound and each hit compound are also displayed in JMol applet.
4.Algorithm
-
Structure of ChemMapper
ChemMapper consists of five components. a). a chemical database contains about 300 000 000 drug like molecular structures; b). in-house 3D-similarity calculation method SHAFTS; c). a compound-target annotation database; d). CPI network inference method for target recommendation and e). a display tool for displaying results.
An outline of ChemMapper’s general design is shown as the figure below.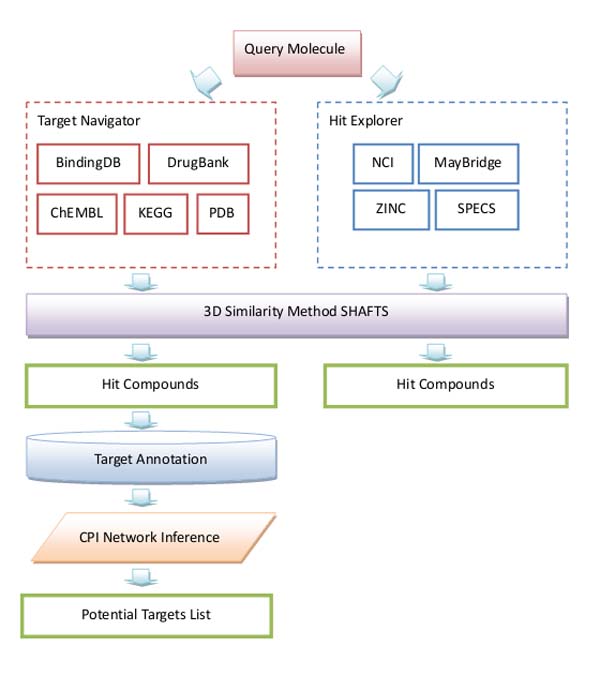
-
Random walk algorithm
The random walk on graphs is defined as an iterative walker’s transition from its current node to a randomly selected neighbor. Formally, the random walk algorithm is defined as:
Rs+1=αPTRs+(1-α)R0 (1)
where P is bipartite network probability transition matrix and Rs is a vector in which i -node holds the resource at the time s step. The coefficient α present probability whether the random walker restart walk at the time s step.
-
Chemical-Protein Interaction network
In ChemMapper Target Navigator mode, we use random walk algorithm to calculate the probability of the path from query molecule to potential targets.
When SHAFTS program finishes its work and generated result hits, a CPI bipartite network between hit compounds and their targets will be constructed. The initial resource vector R0=[RCompound0 RProtein0]T, where RCompound0 was constructed by probabilities according to the similarity score calculated by SHAFTS while RProtein0 was assigned with equal probabilities.
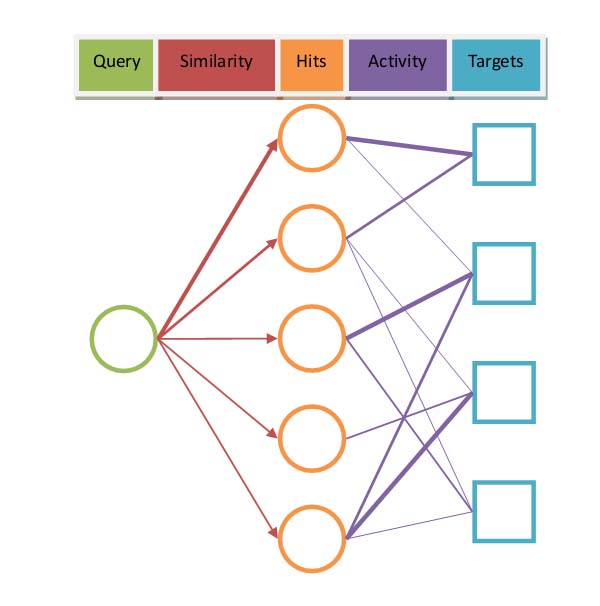
Next we define an adjacency matrix A which present CPI bipartite network according to whether activity data is available. When users choose DrugBank, KEGG or PDB for screen, Aij=1 if Ci and Pj is linked; otherwise Aij=0. On the other hand, if users choose ChEMBL or BindingDB as screen database, the activity between compounds and proteins was also considered. In this case, Aij=-log10(Ki(OR IC50)/100μM) if the activity between Ci and Pj is less than 100μM; otherwise Aij=0.
Then given the adjacency matrix A, the probability transition matrix P could be defined as:
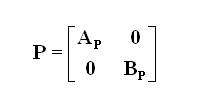
where Ap(i,j)= A(i,j)/sum(A(i,:)) and Bp(i,j)= A(j,i)/(A(:,j)).
Finally, integration of Eq. (1) yields:

Here we use α=0.8. The algorithm will iterate until the change between Rs+1 and Rs fell below 10-6. The predicted targets are ranked according to the values in the steady-state probability vector RProtein+∞.
-
Standard Score
The final result will be normalized by standard score.
The standard score (z-score) was defined as:
Where μ is the mean of the all the relevancy score of all protein terms and σ is the standard deviation of the relevancy score of vector RProtein+∞.